
Fitness
Age, Sex, and Disease-Specific Mortality Contributions to Life Expectancy in Urban and Rural China, 1987–2021
Human life expectancy (LE) has seen remarkable growth over the past century, with China’s LE rising from 35 years in 1949 to 78.99 years in 2024 (1). LE, a key metric in public health initiatives globally, is not influenced by population structure, allowing for comparisons across various demographics (2). However, traditional LE calculation methods, based predominantly on overall mortality rates, have hindered advances by not accounting for the different factors influencing mortality (3–4). Given the disparities in health risks among populations, particularly along gender and urban-rural lines, distinct mortality patterns (LE) are evident (5). Examining the influence of these gender-specific and urban-rural mortality patterns on the increase in LE enhances our understanding of health disparities among populations and provides an essential scientific basis and direction for improving public health policies and interventions (6).
To investigate the influence of diverse diseases and age-specific mortality rates on LE growth in China over the past 35 years, this study employs the Arriaga method. This technique provides a quantitative and systematic methodology for assessing the effects of shifts in population survival and mortality across different age brackets on LE. The analysis is conducted separately for urban and rural populations and is further stratified by gender.
Age-specific and cause-specific mortality data at the national level were sourced from the National Health Commission of China’s Death Registration System. This comprehensive system gathers data from a range of records, including medical certificates, population records, cancellation of household registrations from the Ministry of Public Security, civil affairs cremation records, and terminations from social security records (7). Using a multistage stratified cluster random sampling approach, the Death Registration System selects representative disease surveillance points across all 31 provincial-level administrative divisions (PLADs) in China. Initially, in 1990, the system monitored a population of 10 million, representing approximately 1% of the total population at that time. Since then, it has been progressively expanded; by 2021, it encompassed over 300 million people, approximately 24% of the national population, thereby enhancing its representativeness significantly.
In this study, participants were divided into age groups initially categorized as under 1 year, 1 to 4 years, and subsequently in 5-year intervals for those aged 4 years and older, culminating in an open-ended category for those aged 85 and above, resulting in a total of 19 groups. For analytical simplicity and clarity, these groups were further consolidated into four broader categories: 0–19 years, 20–59 years, 60–79 years, and 80 years and above. Diseases were classified based on the International Classification of Diseases, Tenth Revision (ICD-10). The categories included infectious and parasitic diseases (A00–B99, G00, G03–G04, N70–N73); respiratory diseases (H65–H66, J00–J06, J10–J18, J20–J22, U07.1); circulatory diseases (I00–I99); neoplasms, subdivided into malignant neoplasms (C00–C97) and other neoplasms (D00–D48); diseases of the digestive system (K00–K93); conditions originating in the perinatal period (P00–P96); external causes of morbidity and mortality, categorized as injury (V01–Y89); and other diseases.
Based on all-cause mortality rates across different age groups, a cohort of 100,000 individuals was created using life tables to calculate LE at birth. This study utilized annual data on attributed deaths and all-cause mortality obtained from the China Health Statistics Yearbook, covering urban and rural residents. Mortality rates for each cause were estimated accordingly (5). To analyze changes in mortality rates from 1987 to 2021, we employed the Arriaga decomposition technique. This method allowed us to break down the changes by age and cause, highlighting the direct, indirect, and interactive effects of changes in age-specific mortality rates on LE for specific diseases (8).
Statistical analyses were performed using R (version 4.3.3, R Foundation for Statistical Computing, Vienna, Austria) and Microsoft Office (version 2406, Microsoft, Redmond, Washington, USA).
As depicted in Figure 1, during the 35-year span from 1987 to 2021, both urban and rural regions in China exhibited a consistent increase in LE for both males and females. In 1987, the LE for urban males was 70.99 years, which climbed to 79.30 years by 2021, marking an increase of 8.31 years. Urban females experienced a rise from 73.96 years in 1987 to 84.52 years in 2021, an improvement of 10.56 years, which was notably greater than that observed in males. In rural areas, the LE for males advanced from 66.65 years in 1987 to 77.26 years in 2021, representing a significant gain of 10.61 years. Similarly, rural females saw their LE increase from 72.52 years in 1987 to 82.86 years in 2021, a total rise of 10.34 years.
Trends in life expectancy changes by gender in (A) rural and (B) urban areas in China from 1987 to 2021.
Abbreviation: LE=life expectancy.
Figure 2 illustrates the contribution of various disease categories to LE growth across different demographic groups. For urban females, the decrease in mortality rates from circulatory and respiratory diseases contributed significantly to LE expansion, adding 2.91 and 2.69 years, respectively. Neoplasms accounted for a 1.23-year increase, while digestive system diseases contributed 0.62 years. Perinatal conditions and injuries each added 0.56 and 0.76 years, respectively. Infectious and parasitic diseases contributed 0.37 years, and other diseases added 1.41 years to LE growth. In urban males, reductions in mortality from respiratory diseases and circulatory diseases contributed 1.96 and 1.87 years, respectively, to LE growth. Neoplasms have accounted for a 1.27-year increase, and digestive system diseases added 0.52 years. Both perinatal conditions and injuries added 0.71 years each. Infectious and parasitic diseases contributed 0.46 years, while other diseases added 0.82 years to LE growth. For rural females, significant reductions in mortality from respiratory diseases contributed 3.81 years to LE growth. Circulatory diseases and infectious and parasitic diseases added 1.85 and 0.83 years, respectively. Neoplasms and digestive system diseases contributed 0.55 and 0.72 years, respectively. Perinatal conditions and external causes of morbidity and mortality contributed 0.51 and 0.29 years, respectively. Other diseases made a substantial contribution of 1.78 years to LE growth. In rural males, reductions in mortality from respiratory diseases marked a notable LE growth by contributing 2.84 years. Infectious and parasitic diseases made a significant contribution of 0.80 years. Circulatory diseases added 0.79 years, while neoplasms and digestive system diseases contributed 0.46 and 0.74 years, respectively. Perinatal conditions added 0.61 years, and injuries accounted for 0.13 years. Other diseases had the largest impact on LE growth, contributing 4.24 years.
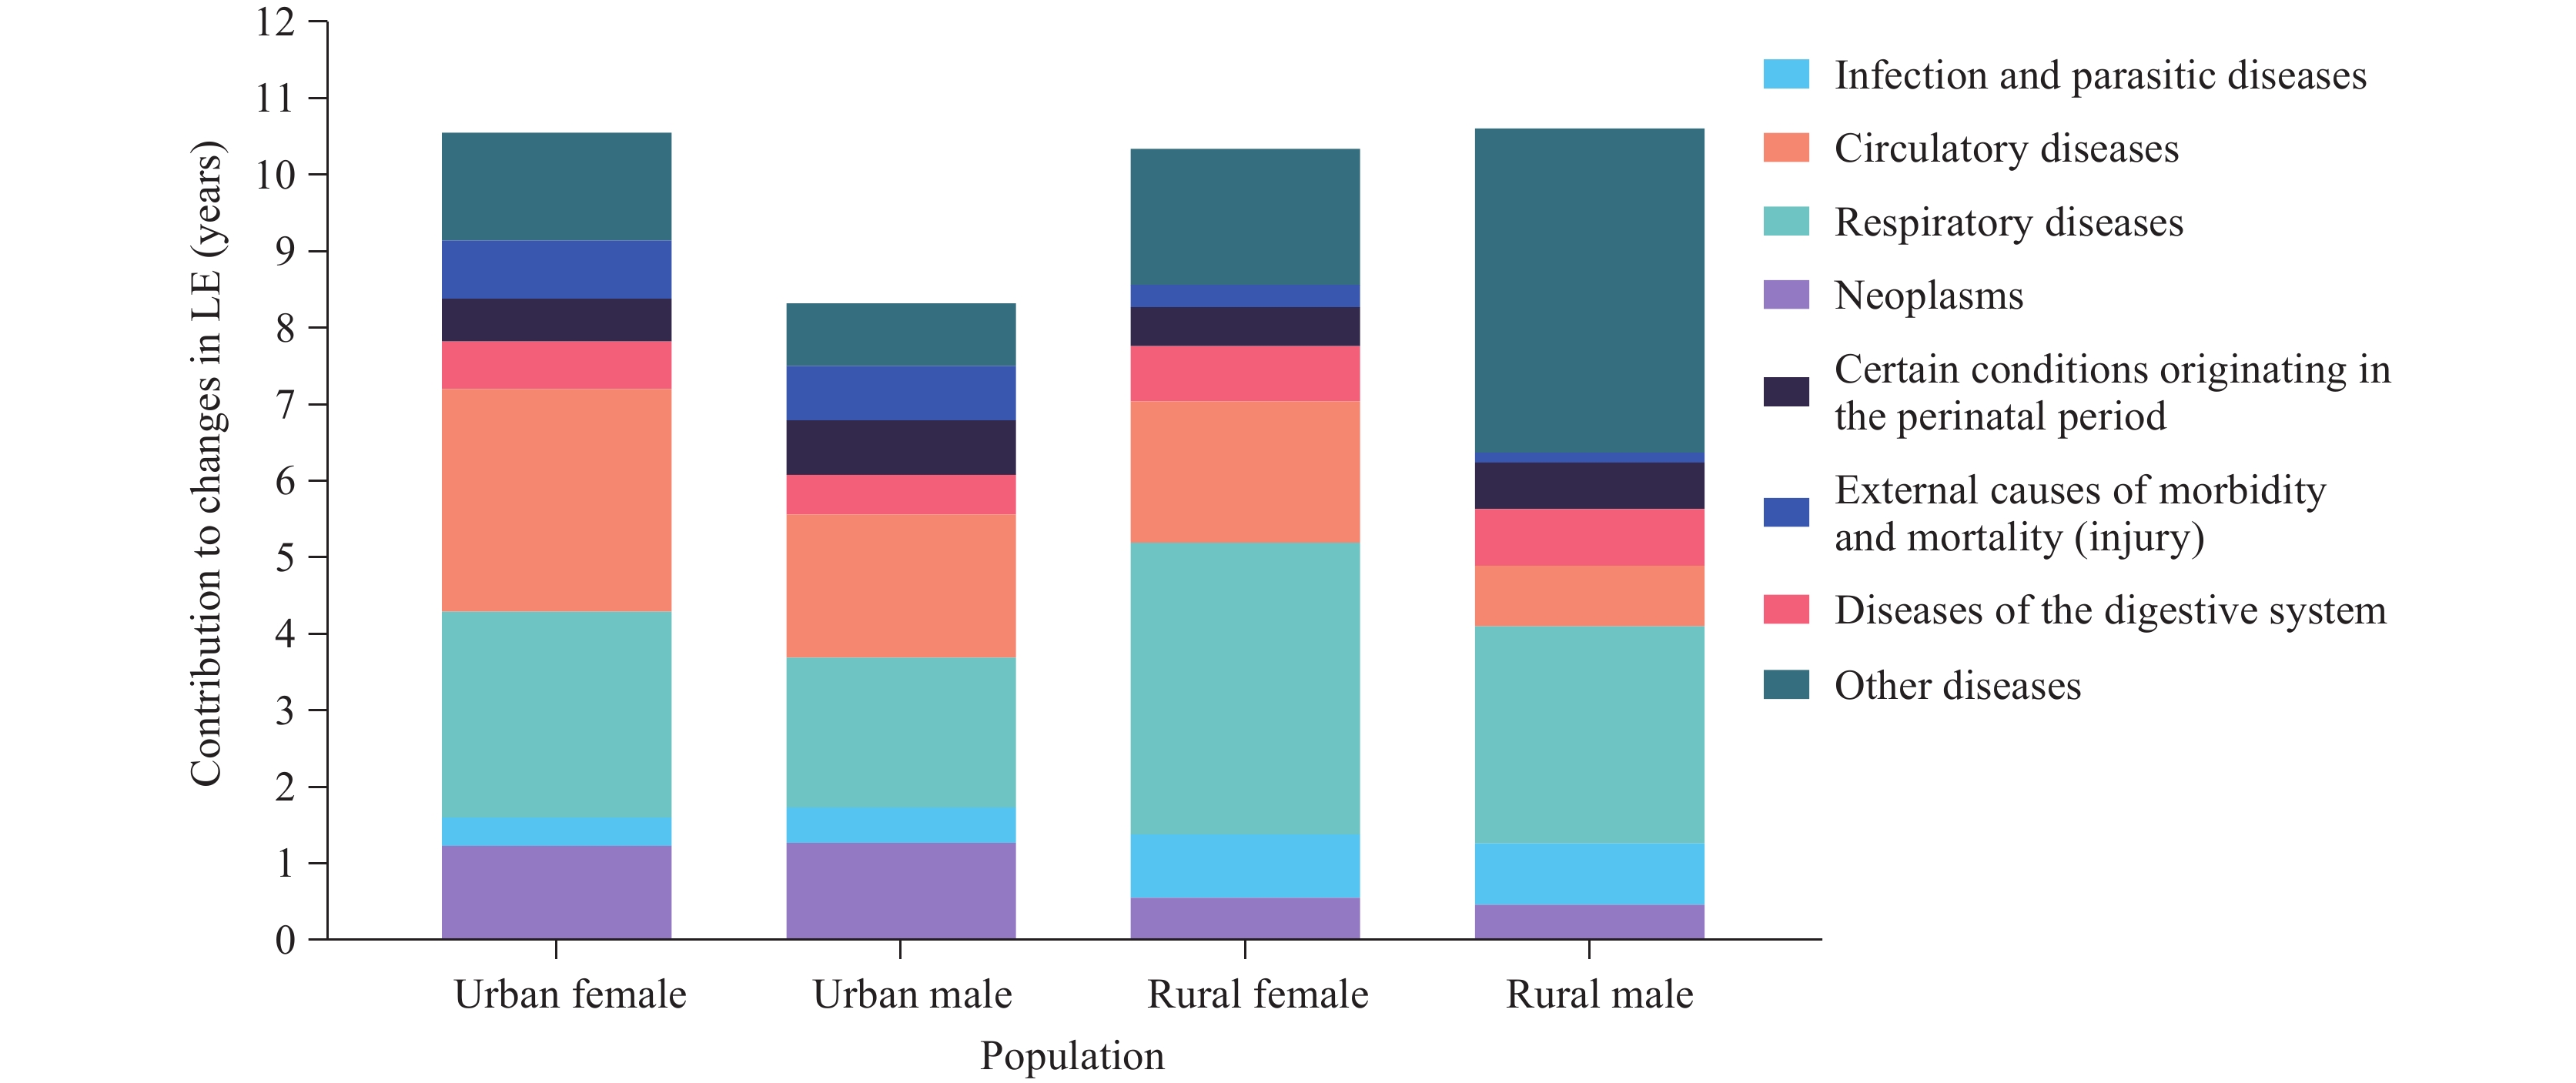
Contributions of different causes of death to life expectancy growth for urban and rural populations in China between 1987 and 2021.
Abbreviation: LE=life expectancy.
Figure 3 demonstrates how reductions in mortality rates across various age groups have contributed to LE increases for urban and rural males and females. For urban females, the most substantial increase originates from the 60–79 age group, which contributed a 5.0-year increase. This was followed by the 20–59 age group, which added 2.1 years. Contributions from the 0–19 and 80+ age groups were comparatively lower, at 1.6 years and 1.9 years, respectively. Among urban males, the most significant increase was noted in the 60–79 age group, contributing 3.6 years. The 0–19 age group added 1.8 years, and the 20–59 age group contributed 1.6 years. The smallest contribution came from the 80+ age group, adding just 1.3 years. In rural settings, females in the 60–79 age group saw the largest increase, contributing 3.2 years to LE. This was followed by the 20–59 age group, which added 2.7 years. Contributions from the 0–19 and 80+ age groups were 2.4 years and 2.1 years, respectively. For rural males, the highest contribution again came from the 60–79 age group, adding 3.8 years. Contributions from the 0–19 age group were 3.2 years, the 20–59 age group contributed 2.5 years, and the lowest was from the 80+ age group, at 1.1 years.

Contributions of different age groups to life expectancy growth for urban and rural males and females in China between 1987 and 2021.
Abbreviation: LE=life expectancy.

From Stadium to Screen: How Technology is Changing Sports Viewing

20/7/2024 Horse Racing Tips and Best Bets – Flemington, Flemington Cup day

Indian tech hub Karnataka state’s move to reserve jobs for locals not finalised, chief minister says

Financial picture dramatically improves for Shamrock Rovers in 48 hours with Sinclair Armstrong deal and European win

Our fashion editor’s favourite affordable bag is 20% off today

Jay Shah’s Big Decision Hovers Over Cricket’s Associate Member Directors Election

Budget shampoo that adds MAJOR volume boost is on sale for Amazon Prime Day: ‘Your hair feels fuller and thicker’

Being active on your commute lowers risk of disease and mental health

Tiger Woods cops brutal Open schedule as full Round 1 tee times revealed
